


The structural and/or functional abnormality of the cardiac electrovascular system is the most common cause of world mortality accounting for 29.0 % of deaths, followed by infectious diseases (16.2 %) and cancers (12.6 %) (WHO 2008 report). 1 Abnormalities in the cardiac electrical system (arrhythmias and sudden death) and/or mechanical function (heart failure) constitute one of the major causes of disability and death, which heavily burden the health care systems across the globe.
For more than 100 years, 12-lead electrocardiography (ECG) has been the standard of care, non-invasive tool, which involves measuring electrical potentials from limited sites on the body surface to diagnose cardiac disorder, its possible mechanism and the likely site of origin. Advances in non-invasive imaging technology have yielded tools such as computed tomography (CT), magnetic resonance imaging (MRI) and positron emission tomography (PET), among several others, which have provided novel insights into the clinical physiology, anatomy and pathologies. These non-invasive diagnostic methods have also improved patient care by providing valuable guidance in the therapeutic management of several cardiac and non-cardiac disorders. Many of these modalities have replaced the invasive imaging techniques as gold standards (e.g. MRI or CT have largely replaced cardiac catheterisation in congenital heart problems).
In cardiac electrophysiology and arrhythmias, several decades of research has led to the development of electrocardiographic imaging (ECGI), a novel three-dimensional (3D), 252-lead, body surface ECG-based, non-invasive epicardial imaging modality. This technique images potentials, electrograms and activation sequences (isochrones) on the epicardial surface of the heart. 2 This tool has been investigated in the normal cardiac electrophysiology and various tachyarrhythmic, conduction and anomalous depo-repolarisation disorders. It has been emerging as a tool of potentially higher clinical value than the 12-lead ECG in terms of sensitivity, specificity and accuracy in the diagnostic and therapeutic management of cardiac rhythm disorders.
Here we describe the potential of this non-invasive mapping technique developed by Rudy 2 in identifying the sources of electrical disorders of the heart like atrial arrhythmias (premature atrial beat, atrial tachycardia, atrial fibrillation), ventricular arrhythmias (premature ventricular beat, ventricular tachycardia) and ventricular pre-excitation (Wolff-Parkinson- White syndrome). In addition, the system has been of clinical value in understanding the abnormalities of His-Purkinje conduction (bundle branch block, intraventricular conduction disturbance and associated heart failure), abnormalities of ventricular action potential (depolarisation [Brugada syndrome and repolarisation], long QT and early repolarisation syndromes) and in evaluating the impact of drugs on His-Purkinje conduction and cardiac action potential.
Mapping Technique
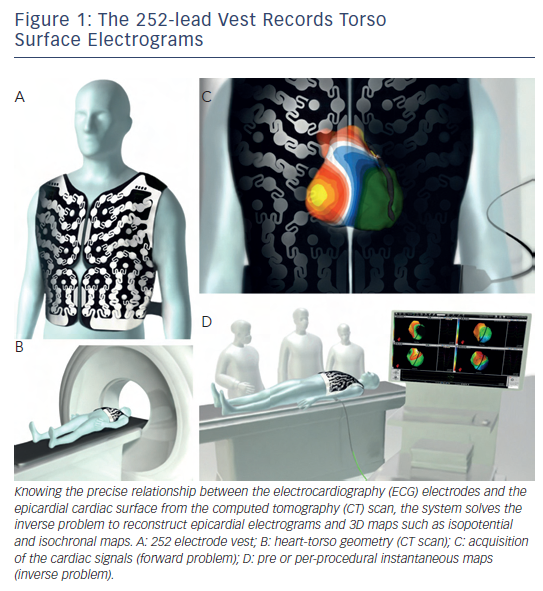
The signal acquisition from the patient and subsequent computational methods used in the reconstruction of non-invasive maps using multiple torso electrodes have been previously described. 2 Briefly, a 252-electrode vest is applied to the patient’s torso and connected to the non-invasive imaging system, and surface potentials are recorded (see Figure 1 ). It is followed by a non-contrast thoracic CT scan to obtain high-resolution images of the heart and the vest electrodes. The 3D epicardial bicameral (atria or/and ventricles) geometries are reconstructed from segmental CT images. The relative positions of body surface electrodes can be visualised on the torso geometry. The system reconstructs epicardial potentials, unipolar electrograms and activation maps from torso potentials during each beat/cycle using mathematical reconstruction algorithms. Details of the mathematical methods have been provided in previous publications. 3–7
Normal Cardiac Rhythm
Until the development of body surface imaging modality, normal atrial and ventricular excitation could be obtained from invasive cardiac catheterisation, intra-operative epicardial mapping 8 or mapping explanted 9 human hearts. With the advent of ECGI, simultaneous 3D recording of whole heart activation is feasible in a normal person under absolute physiological conditions, 10 which have been shown to be in accordance with the observations made and therefore precludes the need for an invasive approach. 8
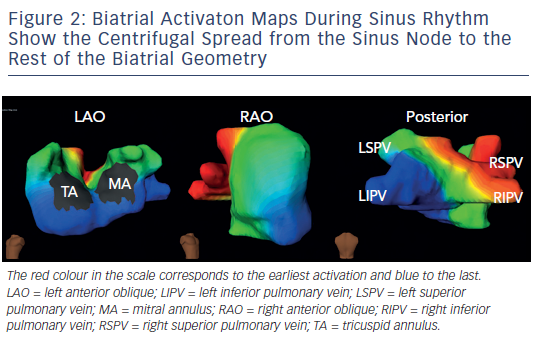
On biatrial maps of sinus rhythm, the activation starts in the right atrium at the anatomical location of the sinoatrial node, where the impulse originates. The impulse propagates to the rest of the right atrium centrifugally and crosses over to the anterior left atrium through the anterior interatrial connection (the bundle of Bachmann). Posterior-inferior left atrium is activated as the impulse travels over the interatrial connection at the ostium of the coronary sinus. These two wavefronts converge onto the lateral left atrium, which is, hence, the last atrial activation site (see Figure 2 – normal sinus beat in the atrium).
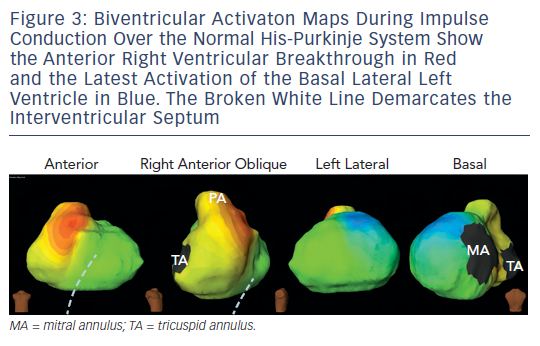
In a normal heart, the cardiac impulse is conducted from the atria to the ventricles via the endocardially situated atrioventricular bundle and the right and left bundle branches of the cardiac conduction system. The Purkinje network establishes a broad activation front in the endocardium, which is followed by impulse propagation to the epicardium; thereby allowing rapid and simultaneous activation and contraction of both the ventricules. When the activation wavefront arrives from the endocardium, epicardial breakthroughs are recorded on the non-invasive imaging tool with rS local electrogram morphology at the earliest sites. The regional activation of ventricular chamber is temporally variable in normal individuals but its global activation largely follows one pattern (i.e. apical to basal). The first breakthrough occurs in the right ventricular (RV) anterior paraseptal region during early QRS. As the activation spreads in all directions from here, additional breakthroughs quickly follow on the RV and left ventricular (LV) epicardium. The latter is generated by the activation of the anterior branch of the bifurcating left bundle. During mid-QRS, more breakthroughs appear in the left-anterior-paraseptal region, right-inferior and apical RV region. Thus normal epicardial RV activation is caused by the coalescence of multiple quick sequential breakthroughs. On the LV, endocardial-to-epicardial propagation activates the anterior LV free wall as stated above. Thereafter, the activation spreads from apical LV region to its base, such that the posterobasal LV is activated at the end of QRS (see Figure 3 ).
Atrial Arrhythmias
Atrial rhythm disorders include isolated atrial premature beats, atrial tachycardias (ATs) and atrial fibrillation (AF).
Atrial Tachycardia and Premature Beat
Wang et al. reported the first successful use of ECGI in the non-invasive diagnosis of the source of a clinical atrial tachycardia. 11 ECGI accurately located the earliest site of atrial activation during focal AT in a patient that had previously undergone two pulmonary vein (PV) isolation procedures. The tachycardia was successfully terminated with radiofrequencyablation in the non-invasively determined location. ECGI can undertake online analysis of one ectopic beat and thereby provide global atrial activation patterns of sustained as well as transient AT non-invasively. The technique therefore has advantage over the sequential mapping technique, a diagnostic method employed by current invasive electroanatomic systems, which necessitates sustenance of AT or repetitive occurrence of ectopic beats, making the approach impractical in intermittent events.
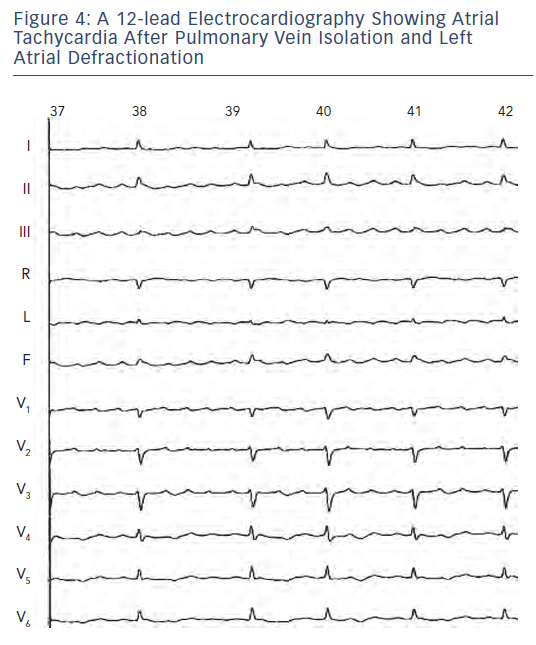
Later, Wang et al. also demonstrated the utility of ECGI in the non-invasive diagnosis of left atrial macroreentrant AT arising in the context of previous AF ablation. 12 Atrial tachycardias are relatively common in patients with AF who have undergone catheter ablation and often require additional mapping and ablation. The system is currently able to diagnose macroreentry where AT encompasses >75 % of the cycle spread over three or more atrial segment versus focal AT diagnosed based on the presence of centrifugal spread of activation from a small source (focus). Of note, the localisation of an AT by analysis of the standard 12-lead ECG is difficult because the interpretation of P-wave morphology recorded on a standard ECG may not be valid in patients with diseased atria who have undergone circumferential PV isolation combined with ablation of biatrial substrate guided by fragmented potentials and/or linear lesions (see Figure 4 ). It should be recognised that ECGI generates the global activation map (potential/isochrone) during a single AT cycle and is therefore well suited to detect rapidly changing arrhythmias. In contrast, point-by-point mapping using the roving catheter and contemporary electroanatomic system requires data from many sequential beats to construct such maps.
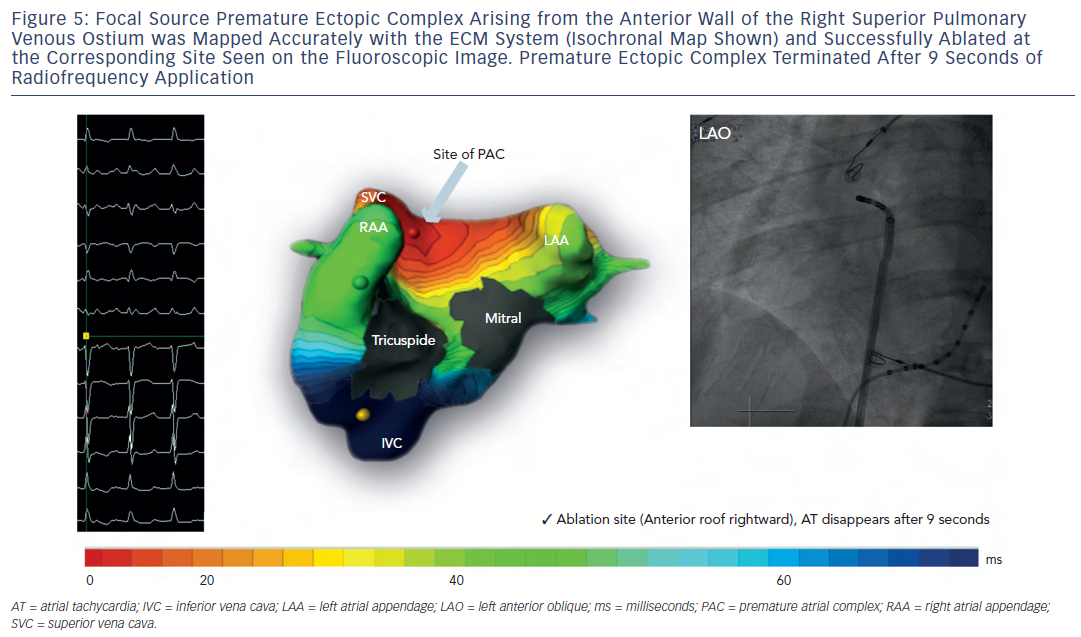
We have prospectively mapped various clinical ATs 13 in a wide range of patients using electrocardiographic mapping (ECM), a non-invasive mapping tool developed for commercial use by CardioInsight technologies Inc, Cleveland, OH, US, based on the principles of ECGI to evaluate the feasibility of this system in defining:
- the mechanism of AT – macroreentrant (perimitral, cavotricuspid isthmus-dependent and roof-dependent circuits) versus centrifugal focal activation; and
- the location (chamber and r egion) generating the arrhythmia in centrifugal ATs (see Figure 5 ).
Fifty-two patients (age 61 ± 11 years; 42 male, structural heart disease in 18) with clinical AT (mean cycle length 284 ± 85 milliseconds [ms]) including those arising de novo , after catheter or surgical AF ablation (n-27) and post-atriotomy were included from three world centres. 13 All patients were first mapped bedside using ECM, followed median of one day (Inter Quartile Range: 1.7) later by invasive mapping and ablation. The invasive operator was blinded to the non-invasive diagnosis. Invasive electrophysiological mapping was performed using conventional electrogram and 3D electroanatomical mapping system (Carto XP, Biosense Webster, US or NavX, St Jude Medical Inc, US) guidance. ECMap was considered accurate when the detection of the clinical target by ECM matched with that obtained on invasive EP mapping and subsequently confirmed by successful ablation. The ECM diagnosis was evaluable in 48 of 52 patients. In four patients, clinical AT converted to another rhythm (AT and AF in one each and sinus in two) before invasive mapping was completed, and therefore, these patients were excluded from the comparative analysis.
Out of 48 evaluable clinical ATs, 27 ATs were diagnosed in the electrophysiology (EP) laboratory as macroreentrant and 21 as centrifugal arrhythmias. All of them were successfully terminated by ablation resulting in sinus rhythm in 44, or to another AT in four. The overall diagnostic accuracy of ECM compared with invasive EP diagnosis, the gold standard, was 92 % – 100 % in patients without any previous ablation and 83 % in patients with previous AF ablation(s). ECM was particularly useful and adept at accurately diagnosing centrifugal ATs in 100 % of patients including 11 (58 %) patients with previous AF ablation. In this study, the primary reason of failure to diagnose the arrhythmia mechanism in four out of 48 (8 %) evaluable ATs was 2:1 atrio- ventricular conduction, precluding the selection of a full tachycardia cycle (unmasked by QRST complex), which is necessary for ECM single cycle analysis. This can be addressed clinically by administration of atrioventricular node blockers or simple pacing manoeuvres during the invasive procedure to unmask multiple P waves. In addition, some post-ablation atria exhibited substantially lower ECG P-wave amplitude, which further complicated and challenged the diagnosis, contributing to lower accuracy in post-AF ablation ATs (83 %). Since ECM is a single beat/cycle mapping technology, noise reduction using a signal-averaging algorithm is being investigated with promising results to improve the accuracy in low voltage substrate-based arrhythmias.
A potential limitation of the system is its inability to provide direct mapping of the septum. Since the septum is not an epicardial structure and therefore not included or displayed on the map, a septal source is deduced by demonstrating simultaneous activation of both chambers from the interatrial groove. While precise localisation on the septum may not be feasible for septal-source ATs, the deductive information may suffice with regard to ablation of target in the region of interest.
Although there is evidence for differential activation of the contiguous endo-epicardium in the atria (in at least some of its parts), the difference, at best, could be considered modest considering that the atrial tissue is much thinner in most parts than the ventricular myocardium.
Atrial Fibrillation
Cuculich et al. studied continuous biatrial epicardial activation patterns of human AF using non-invasive electrocardiographic mapping. 14 In the testing phase, mapping accuracy was evaluated by atrial pacing in six patients and comparing the maps with co-registered CARTO (Biosense Webster, Diamond Bar, California) images. Spatial accuracy for determining initiation sites from pacing was six millimetres (mm). Additionally, correlative observations from catheter mapping and ablation were compared with non-invasive mapping in three patients. In the study phase, non-invasive maps during AF in a wide range of 26 patients were analysed for mechanisms and complexity. The low-amplitude signals of AF were successfully mapped in 97 % of patients. The diverse but co-existing and reproducible (over the data collection period of minutes to hours) biatrial activation patterns during AF included multiple wavelets (1–5 and most commonly two wavelets) in 92 %, ill-sustained rotors in persistent AF involving the posterior left atrium near the PV ostia predominantly and the anterolateral right atrium rarely in 15 %, pulmonary venous foci in 69 %, non-PV foci in 62 %, and less commonly a single-wave re-entry involving both the atria in the same order of decreasing complexity. The complexity of the patterns of AF generally increased with the duration of uninterrupted
AF and therefore it was higher in persistent AF than paroxysmal AF. Among persistent and long-standing persistent AF, there was overlap in the complexity of these patterns.
In a recent development, phase technique to map AF simultaneously displays co-existence of various mechanisms during the recording period.
Ventricular Arrhyhtmias
Ventricular Tachycardia and Premature Beat
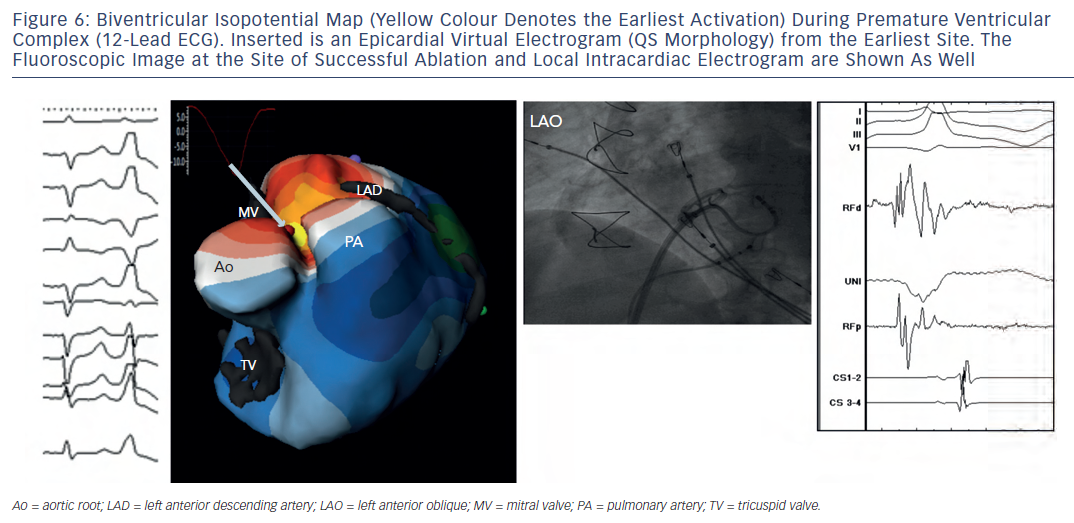
Intini et al. used the electrocardiomapping technique for the first time clinically to guide diagnosis and therapy of a focal ventricular tachycardia (VT) in a young athlete. 15 Isolated ventricular ectopic beats of an identical morphology to the sustained tachycardia were mapped prior to the invasive procedure, and their origin was localised to the LV apical diverticulum. Importantly, the QS wave pattern of the re-constructed electrogram from the site of origin of the ectopies indicated that those beats were emanating from the ventricular epicardium at that site. Figure 6 shows an example of a similar premature beat. In the EP laboratory, the sustained tachycardia was induced in the presence of isoproterenol. Intracardiac activation mapping during tachycardia demonstrated earliest activation in the apical LV diverticulum. During sinus rhythm, pace map at that site was remarkably similar to the tachycardia morphology in 12/12 ECG leads. Electroanatomic 3D mapping (CARTO) of the LV chamber performed during the ectopy also identified the earliest site of activation at the LV apex in the region of the diverticulum, consistent with a focal origin of the tachycardia. Later, transient resolution of the tachycardia during several radiofrequency applications delivered endocardially to the area, supported an epicardial origin for the arrhythmia. On invasive epicardial approach, the earliest activation of the ventricular ectopy was identified in a region of low voltage ( < 1.45 millivolts [mV]) at the LV apex overlying the region of endocardial abnormality. Cryolesions (-70 degree Celsius [°C]) were placed in the low-voltage area. Close proximity to the phrenic nerve, assessed by capture during pacing, precluded complete ablation of the region resulting in recurrence of the arrhythmia.
Wang et al. studied 26 ventricular arrhythmias in 25 patients (tachycardias [n-9], premature beats) using a non-invasive electrocardiomapping technique prior to (n-19) and during (n-4) the invasive procedure to localise the site of origin of the arrhythmia, to evaluate the mechanism based on the pattern of arrhythmia propagation and its relationship to the myocardial substrate, and to correlate the site of origin with local electrogram morphology (QS wave for epicardial origin, rS complex for intramural or endo-cardial origin). 16 ECGI correctly identified the right or left ventricular location of the arrhythmia in 100 % of studies (n-23). When the specific locations within each ventricle were compared, non-invasive ECGI was in agreement with the invasive EP study in 10 out of 11 RV sites (91 %) and in 11 out of 12 LV sites (92 %). For the two patients with discrepancies between invasive and non-invasive modalities, the discrepant locations were in proximity to each other. For the patient with right posteroseptal RV location, ECGI imaged the right posterolateral base as the location. This patient had undergone previous ablations of a right posteroseptal accessory pathway and a right atriofascicular pathway in the posterolateral base, which were suspected to have played roles in the discrepancy between the two diagnoses. For the patient with apical LV location, ECGI imaged the mid-anterior LV as the location. This patient had a large LV apical aneurysm and several different VT morphologies with discrepancy possibly from the comparison of two different VTs sequentially imaged non-invasively followed by invasively. The arrhythmia mechanism was correctly diagnosed as focal (18 out of 18) and re-entrant (5 out of 5) in 100 % of patients based on the centrifugal and early-meeting-late patterns of activation, respectively. Invasive findings were compared with ECGI for determining epicardial versus non-epicardial locations of VT. As a result of the thin tissue in the outflow tract, patients with outflow tract were excluded. Of the 13 remaining patients, the invasive study determined the location to be endocardial in six, epicardial in five and mid-myocardial in two. All five patients with epicardial location had QS wave at the site of earliest activation (100 %), indicative of epicardial origin, non-invasively. Among the patients with a non-epicardial location, the local electrogram at the earliest site demonstrated a small r wave in seven of eight (88 %). The spatial accuracy of non-invasive imaging has been cited as a possible limitation, but the most significant weakness of the ventricular imaging involves the variable contributions of the endocardium and epicardium to the arrhythmia as much as the septal location of the arrhythmia. The earliest epicardial activation of VT may not accurately identify the location of an endocardial circuit. Also, currently slow, discontinuous delayed systolic/diastolic conduction inside the scar (late potential) may not be visualised.
In another multicentre study, 35 premature ventricular beats imaged non-invasively were accurately diagnosed in 100 % of patients with regard to chamber identification and focal mechanism. 17
Ventricular Pre-excitation
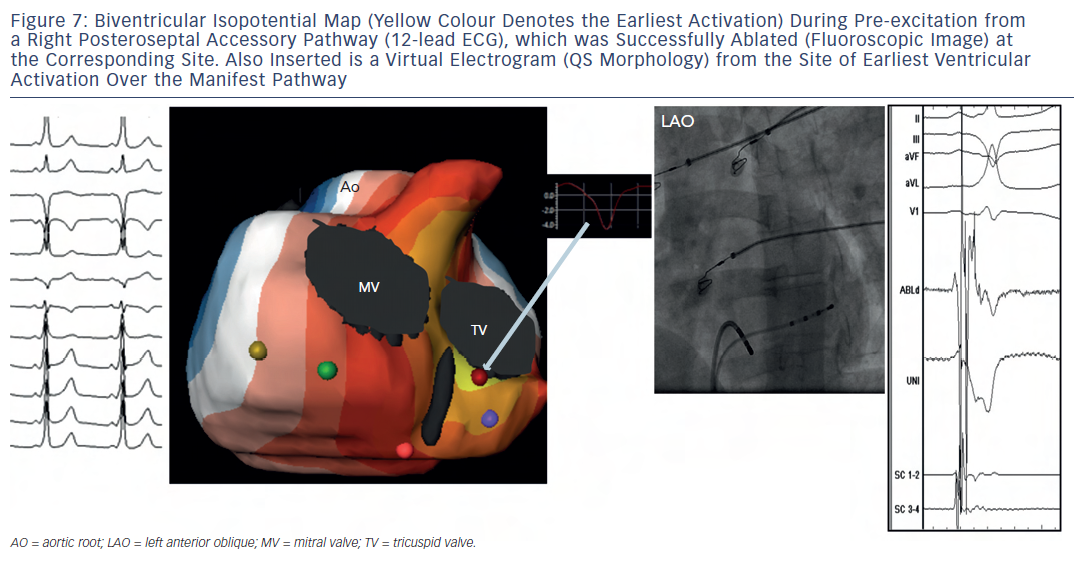
Ghosh et al. imaged 14 paediatric patients with Wolff-Parkinson- White syndrome and no other congenital disease, with ECGI a day before successful catheter ablation. 18 The pre-excitation sites were consistent with sites of successful ablation (five left lateral, four left posteroseptal, two right posteroseptal, one right mid-septal, one right posterior and one in the coronary sinus diverticulum), qualitatively, in all cases to within a one-hour arc of each atrioventricular annulus. In a patient with two closely-situated accessory pathways, ECGI showed two contiguous epicardial breakthroughs. Based on the electrogram morphology (QS versus rS patterns), ECGI could differentiate between the endocardial (12) and epicardial (two) locations of the accessory pathways.
Ghosh et al. also reported qualitatively accurate ECGI imaging of accessory pathways observed in patients with structurally abnormal hearts like hypertrophic cardiomyopathy, Ebstein’s anomaly and status post repair of a univentricular heart. 19–21 In another multicentre study, seven patients with Wolff-Parkinson-White syndrome imaged non-invasively were accurately diagnosed with regard to the identification of the ventricular epicardial breakthrough site of pre-excitation (delta) wave 17 (see Figure 7 ).
Fast/Rapid Mapping
Being a non-invasive system, ECM is a mapping technology that can be applied bedside, potentially providing an electrophysiologist with all the information necessary to plan the procedure before ablation is undertaken. Therefore, we evaluated the clinical impact of ECM on reducing the procedure time, fluoroscopic exposure and in general the efficacy of the ablation procedure by undertaking the ablation of premature ventricular beats (RV-5, LV-5), atrial tachycardia and ectopic beats (RA-0, LA-3), and manifest accessory pathways (RV-2, LV-4) guided exclusively by the pre-procedural ECM-based diagnostic mapping. All ventricular ectopics were diagnosed accurately and successfully ablated. One perimitral AT could not be diagnosed by ECM imaging. An accessory pathway successfully ablated in the left mid-septal region was diagnosed as left anterolateral pathway based on its earliest epicardial breakthrough. A right posterolateral accessory pathway was accurately diagnosed but could not be successfully ablated at the index procedure. Excluding these three arrhythmias, the median times for the procedure, cardiac catheterisation to permanent arrhythmia elimination, radiofrequency application and fluoroscopic exposure were 70.0 minutes (min), 19.7 min, 5.6 min and 11.4 min, respectively. Although the observational study holds promise, randomised studies are necessary to ascertain the benefits of fast mapping over invasive mapping with or without electroanatomic systems.
Clinical Application in Heart Failure
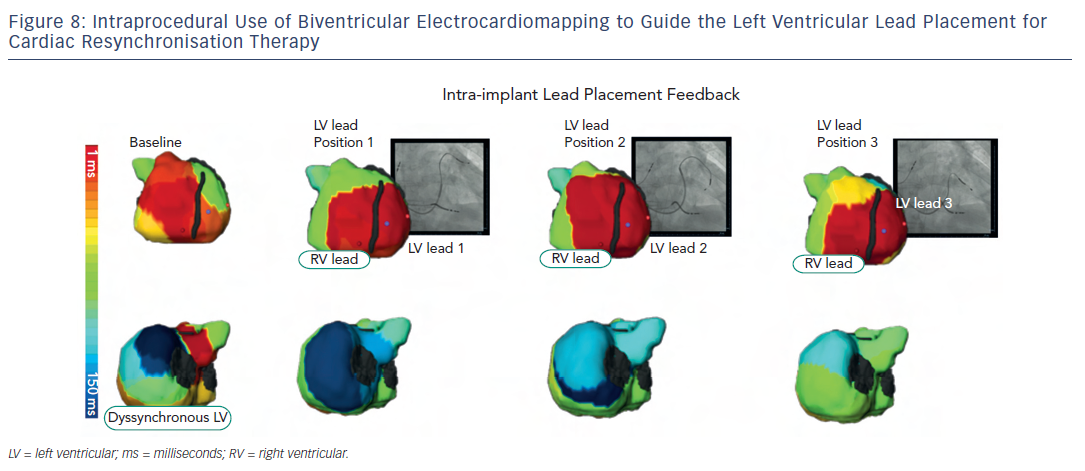
Besides non-invasive identification of sources, ECM has been of clinical value in cardiac resynchronisation therapy (CRT) for heart failure. CRT using biventricular pacing has been developed to restore electromechanical synchrony and improve cardiac performance in patients with refractory heart failure. However, it has been clinically beneficial to 65–70 % of patients who receive it. Being an electrical (pacing) approach, detailed electrical information during CRT is critical in understanding its mechanism and clinical outcome. Electrocardiomapping is a superior tool than standard ECG to non-invasively obtain this information. 22,23 Most remarkable about ECM is its ability to guide lead placement to the area of latest electrical activation perprocedurally (see Figure 8 ). Silva et al. and Ghosh et al. computed the left ventricular electrical dyssynchrony index as the standard deviation of local activation times at 500 sites on the left ventricular epicardium based on which the CRT responders could be pre-identified among a wide range of heart failure patients. Current guidelines-based recipients of CRT who benefited from the therapy had high dyssynchrony index at baseline, which dropped substantially post-therapy. Non-responders had low dyssynchrony index at baseline or did not substantially drop the index-value post resynchronisation. 24,25
Conclusion
Clinical experience with the novel, non-invasive electrocardiomapping system demonstrates the feasibility of accurately identifying the cardiac chamber harbouring the arrhythmia and defining the mechanism of a wide range of atrial and ventricular arrhythmias, as well as disorders of electrical synchrony. The widespread pre- and per-procedural clinical utility of the system in panoramic 3D mapping of various simple and complex tachyarrhythmias, including those arising post-AF ablation, and in describing the global cardiac activation patterns in complex conduction problems edges past 12-lead ECG, the current standard of care for all electrical abnormalities of the heart. Rapid, reliable and the single beat/cycle-based diagnostic ability of the system expresses its potential to reduce ablation, fluoroscopic and procedural times.