


Experimental and clinical studies have demonstrated that enhanced sympathetic autonomic nervous system (SANS) activity can destabilise myocardial repolarisation,1–4 increasing vulnerability to developing fatal cardiac arrhythmias.5–8 Accordingly, assessment of SANS activity has always been a major goal for cardiac risk stratification methods. Various non-invasive methods including assessment of heart rate variability (HRV) and baroreflex sensitivity have been employed to study the activity of the SANS under routine clinical conditions.9 These methods are based on two principles. First, activation of the SANS evokes physiological effects on the cardiovascular system, such as acceleration of heart rate, increased vasomotor tone or systolic contractility.4 Second, as SANS activity is clustered in low-frequency bursts, SANS-induced physiological responses are likely to exhibit low-frequency dynamics.10–14
Previous studies have shown that SANS assessment based on HRV and baroreflex sensitivity is a marker of increased vulnerability to fatal cardiac arrhythmias.15,16 However, both methods are limited by the fact that they only provide an indirect probe of the sympathetic effect on cardiac repolarisation, as they reflect influences on the sinoatrial node and blood vessels and not on the ventricular myocardium. In addition, both HRV and baroreflex sensitivity are confounded by the concomitant action of other systems exhibiting periodic dynamics, such as the parasympathetic nervous system and the renin–angiotensin– aldosterone system, respectively.
We proposed a novel approach to SANS assessment that substantially differs from previous methods.17 So-called periodic repolarisation dynamics (PRD) evaluates sympathetic activity-associated lowfrequency periodic changes of cardiac repolarisation instability and opens new perspectives for identifying high-risk patients, who would potentially benefit from prophylactic interventions. The first section of this review briefly depicts the methodology of PRD assessments. The second section focuses on potential mechanisms of PRD. In the third section, the clinical application of PRD as risk predictor after myocardial infarction (MI) is presented. In the fourth section, we present an alternative method for PRD assessment, which provides some technical advantages over the standard method. The final sections are dedicated to ongoing and future projects aimed at developing individualised treatment strategies.
Methodology of Periodic Repolarisation Dynamics Assessment
PRD is typically assessed using a high-resolution ECG recorded in or converted to the three orthogonal axes X, Y and Z (‘Frank lead configuration’). As low-frequency patterns are of interest, the recording time should be >10 minutes, although PRD has also been assessed in shorter time periods.17 Ideally, the ECG is performed under strict standardised conditions in the supine position.
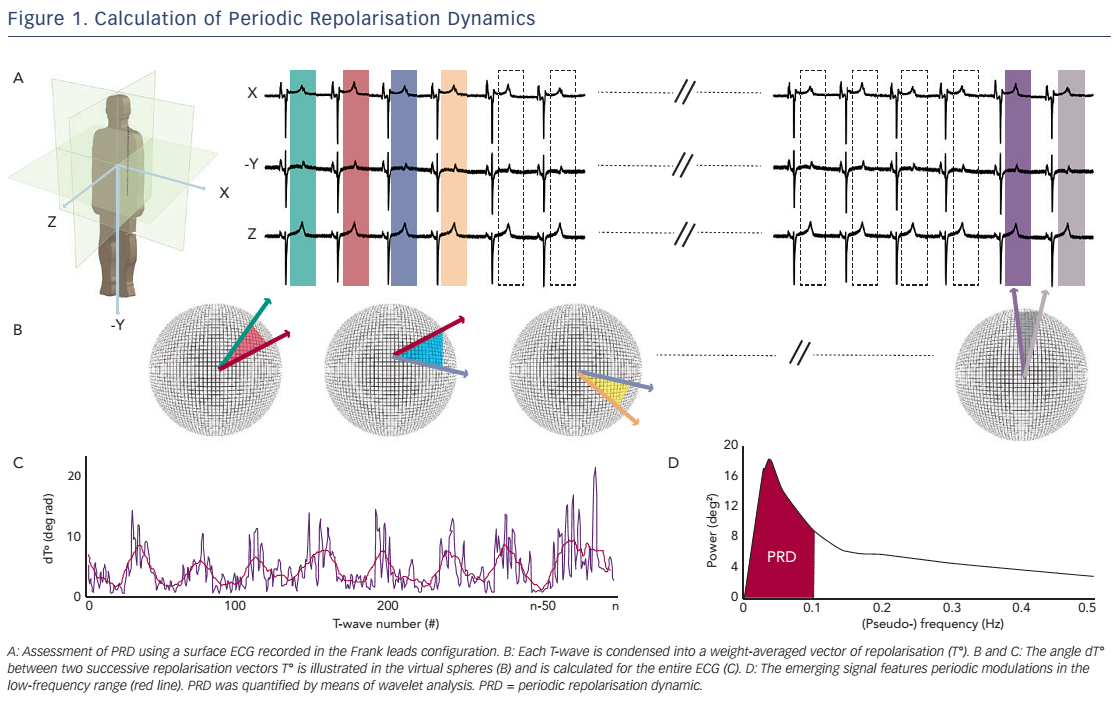
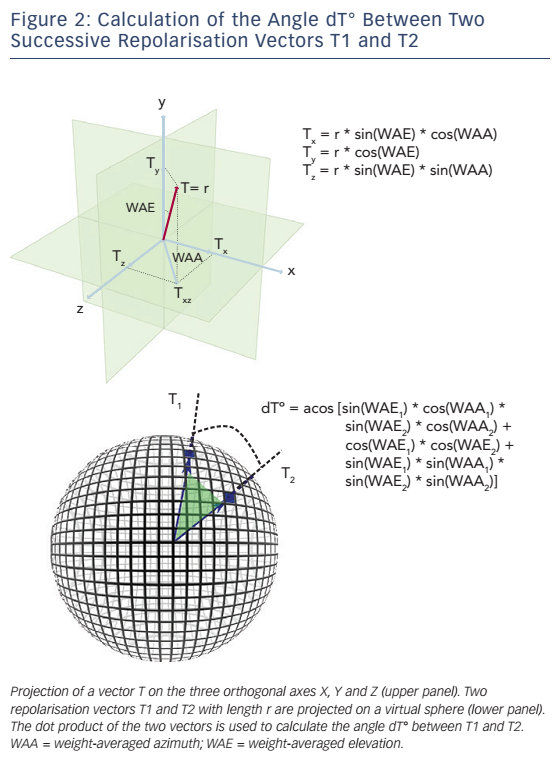
The technique used to calculate PRD is briefly illustrated in Figure 1.17 In a first step, the ECG is converted to a set of polar coordinates defined by two angles (azimuth and elevation) and the ‘resultantforce’ amplitude (Amp). The beginning and ending of each T-wave are identified using previously published algorithms.18,19 In a second step, the spatiotemporal characteristics of each T-wave are mathematically integrated into a single vector T° (see Figure 2), defined by the so-called weight-averaged azimuth (WAA) and weight-averaged elevation (WAE). The computation of WAA and WAE are given by Equations 1 and 2, respectively:

Of note, WAE and WAA are weighted by Amp. This means that each point of the T-wave contributes proportionately to its absolute amplitude to the final direction of vector T°. Accordingly, the boundaries of the T-wave are less crucial than the T-wave peak.
In a third step, the instantaneous degree of repolarisation instability is estimated by the angle dT° between successive repolarisation vectors. dT° can be calculated as the scalar product of two successive repolarisation vectors T°, which by two vectors of the same length r can be simplified by Equation 3 (see Figure 2):

In a final step, low-frequency (≤0.1 Hz) oscillations are quantified within the dT° signal by means of a continuous wavelet transformation (PRDwavelet; see Figure 1D).17
Potential Mechanisms of Periodic Repolarisation Dynamics
The exact mechanisms underlying PRD are still unknown. However, it is most likely that PRD represents the effect of the sympathetic nervous system on the myocardium.
First, PRD mimics the characteristic low-frequency pattern of efferent sympathetic activity.11,12,14 Low-frequency patterns can also be found in other biological time series such as heart rate or arterial blood pressure, where they have been shown to correlate with low-frequency sympathetic bursts (muscle sympathetic nervous activity).10 Moreover, the amplitude of these oscillations has been shown to be related to the level of sympathetic stimulation. For instance, Pagani et al. showed that sympathetic activation provoked by infusion of nitroprusside in healthy human subjects increased low-frequency oscillations of heart rate and systolic arterial blood pressure.10
Second, indirect evidence comes from physiological and pharmacological studies. Provocations such a tilt test or exercise led to increased PRD in healthy individuals, while pharmacological blockade of the sympathetic nervous system by b-blockers suppressed PRD.17 PRD remained intact after elimination of HRV and respiratory variability using fixed atrial pacing in patients during an electrophysiological study and fixed-rate, volume-controlled ventilation in a swine model, respectively.17
Third, a potential electrophysiological correlate of PRD was identified by Hanson et al.20 The authors assessed action potential durations (APDs) from unipolar electrograms in patients with heart failure invasively recorded during an electrophysiology study and demonstrated a low-frequency pattern of APD. Although the correlation of oscillations of APD with PRD was not tested in that study, it is likely that both oscillations are driven by the same mechanism.
The mechanistic link of low-frequency sympathetic activity to periodic changes in cardiac repolarisation requires further investigation. A possible mechanism could involve non-uniform response of ventricular myocardial cells to sympathetic activation. Generally, sympathetic activation results in a shortening of APD. Studies conducted over the past few decades demonstrated that the ventricular myocardium is not homogenous, but is comprised of at least three different cell types (epicardial cells, M cells and endocardial cells) with distinct electrophysiological characteristics and pharmacological properties.21 The electrical heterogeneity between the three cell types of ventricular myocardium creates transmural and apico-basal voltage gradients during the repolarisation phase, causing inscription of the T-wave on the surface ECG.22 It has been shown that the myocardial cells of the various cell layers respond differently to sympathetic activation. Therefore, theoretically sympathetic activation should lead to changes in the spatio-temporal properties of the T-wave in the surface ECG, which are captured by PRD. The heterogeneity of sympathetically induced APD changes can be augmented in various diseases, including MI,4 diabetes mellitus23 and inherited channelopathies.2,24
Periodic Repolarisation Dynamics as a Risk Predictor After Myocardial Infarction
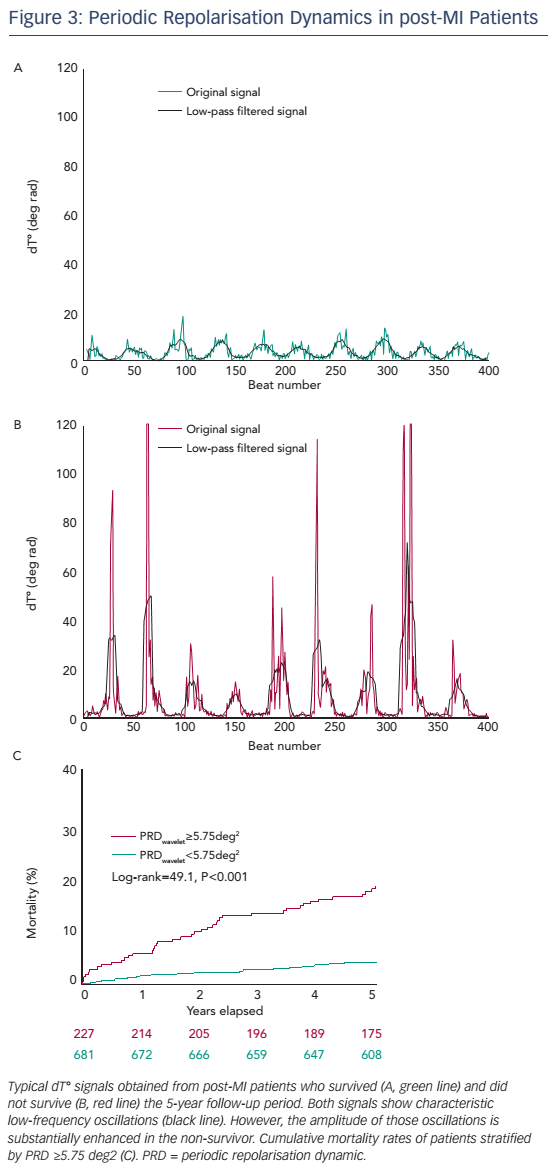
The prognostic significance of PRD has been tested in a cohort of 908 survivors of acute MI of the Autonomic Regulation Trial.17 The primary endpoint was all-cause mortality. In the first 5 years of follow-up, 69 patients died. Figure 3 shows typical dT° signals in surviving and nonsurviving patients. In both signals, low-frequency oscillations of dT° were present, but in the non-surviving patient the amplitude of these oscillation was much more pronounced. For survival analyses, PRDwavelet was dichotomised at the upper quartile of the study population.17 The 5-year mortality rate in the group of the 227 patients with PRDwavelet ≥5.75 deg2 was 18.2 % compared with 4.1 % in the 681 patients with PRDwavelet <5.75 deg2 (P<0.001; see Figure 3B). In multivariable analyses PRDwavelet was revealed to be a strong predictor of mortality after MI and its predictive ability was independent from established risk predictors, such as left-ventricular ejection fraction (LVEF), the Global Registry of Acute Coronary Events (GRACE) score, presence of diabetes mellitus, reduced HRV and increased QT-variability index.
Alternative Quantification of Periodic Repolarisation Dynamics by Means of Phase-rectified Signal Averaging
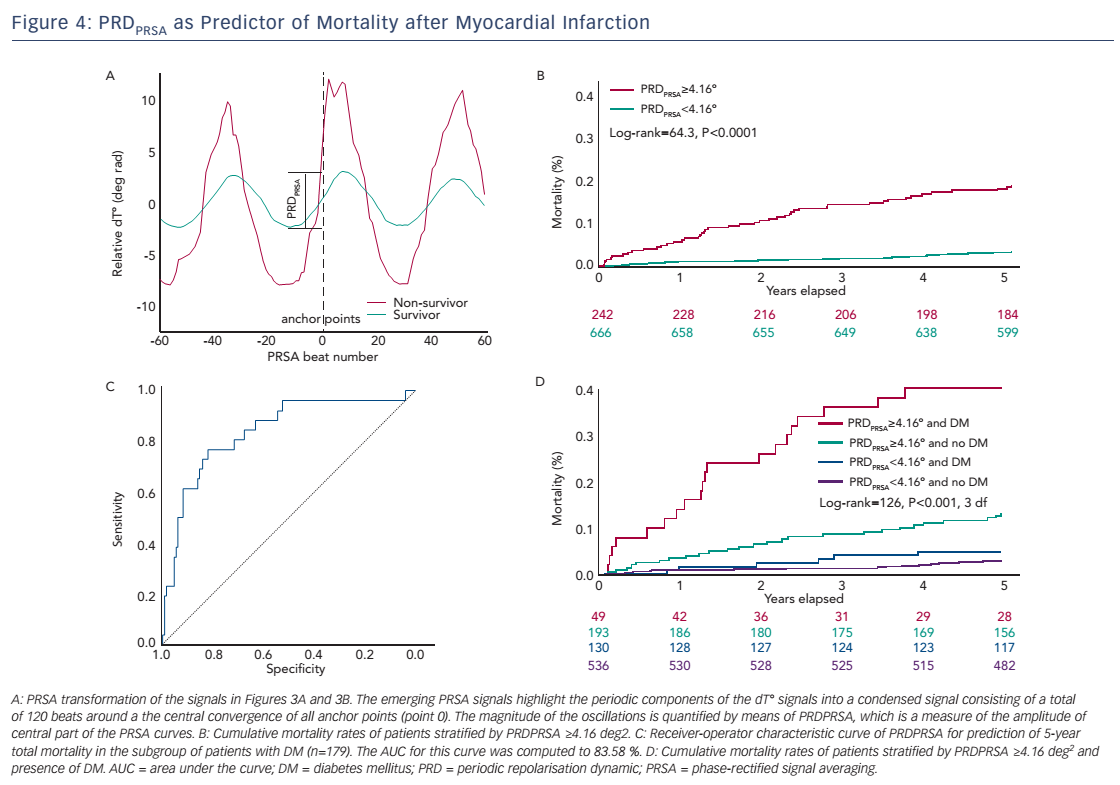
The original assessment of PRD from the dT° signal includes continuous wavelet transformation, which requires some computational resources and which might not be available in all software packages. In this section, we therefore describe an alternative method to quantify PRD from the dT° signal using the technique of phase-rectified signal averaging (PRSA). PRSA is a mathematical procedure that allows the extraction of periodicities from complex time series that might include non-stationarities, noise and artefacts.25 PRSA has been originally used to detect deceleration-related (deceleration capacity; DC) and acceleration-related (acceleration capacity; AC) modulations of heart rate. DC has been shown to yield strong and independent prognostic information in survivors of acute MI.26 The PRSA technique consists of a three-step procedure and allows for several adjustments, which can optimise the method to the particular signal analysed and the frequency range of the detected oscillations. In the first step, anchor points are selected according to certain properties of the signal. In the case of the dT° signal we defined absolute angle increases greater than 1.25° (deg rad) as anchor points. To amplify the low-frequency periodicities, a low-pass filter of T=9 (average of nine successive beats) is intentionally set up for the selection of anchor points. Although the PRSA technique is able to detect oscillations in a wide frequency range, it has been shown mathematically to be more sensitive for strictly periodic oscillations with frequency {f=1/[2.7*T]}. This means that for frequencies between 0.025 and 0.1 Hz the optimal T ranges between 4 and 15. To maximise the sensitivity at the centre of our spectrum while maintaining a good sensitivity at the boundaries of the frequency range, we used the mean value of T=9. In the second step of the PRSA method, windows (L) around each anchor points are defined to both the left and right of the anchor point (in this case L=60 beats). Finally, in the third step, a new PRSA signal is obtained by averaging over all windows. The central part of the PRSA signal (see Figure 4A) is then quantified by Haar wavelet analysis and is defined as PRDPRSA.
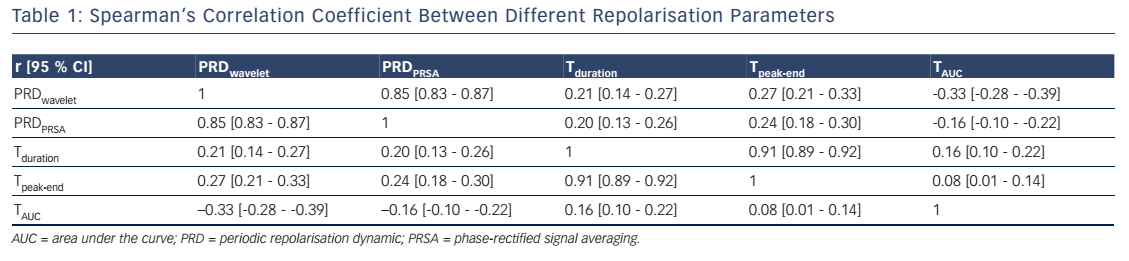
Table 1 depicts the Spearman’s correlation coefficients between different repolarisation parameters in the 908 patients of the Autonomic Regulation Trial. The correlation coefficient between PRDPRSA and PRDwavelet was 0.854 (95 % CI [0.835–0.871]; P<0.001; see Table 1). Of interest, the correlation of PRDPRSA and PRDwavelet with other ECGbased measures of repolarisation was weak (see Table 1). Figure 4A illustrates the corresponding PRSA transformations of the dT° signals illustrated in Figure 3. PRDPRSA was significantly associated with mortality (4.99° [interquartile range (IQR) 3.19] in non-survivors versus 2.58° [IQR 2.29] in survivors; P<0.001). To identify the optimal cut-off value for PRDPRSA we used log-rank statistics for all possible cut-off values. The maximum log-rank value was achieved with a cut-off value of 4.16. Figure 4B shows 5-year cumulative mortality rates stratified according to patients with PRDPRSA ≥4.16° and <4.16°. The 242 patients classified to the high-risk group (PRDPRSA ≥4.16°) had a 5-year mortality rate of 19.1 %, compared with 3.5 % for the 666 patients belonging to the low-risk group (PRDPRSA <4.16°). Multivariable analyses revealed that PRDPRSA was a strong predictor of mortality that was independent from LVEF ≤35 %, the GRACE score, HRV and other established risk markers.
Sympathetic-associated modulations of repolarisation might be of great prognostic value in patients with inhomogeneous innervation of the ventricular myocardium. We therefore tested the predictive power of PRDPRSA in a subgroup of 179 patients suffering from diabetes mellitus. PRDPRSA was significantly associated with all-cause mortality in this subgroup. Receiver operating characteristics analysis revealed an area under the curve (AUC) of 83.58 % (see Figure 4C; 95 % CI [73.10–91.00]) for prediction of 5-year mortality. Figure 4D depicts risk stratification by PRDPRSA in patients with diabetes (red and blue curves) and those without diabetes (green and black curves). The 49 patients with diabetes with abnormal PRDPRSA values have the worst prognosis with a cumulative 5-year mortality rate of 40.80 %.
New Perspectives in Risk Stratification and Risk Reduction Strategies
Periodic Repolarisation Dynamics in Patients With Inherited Channelopathies
Increased sympathetic activity is associated with unfavourable outcomes not only in post-MI patients, but also in patients with inherited channelopathies such as the long-QT syndrome.2 Assessment of PRD in this group of patients would be of great clinical interest and might open a new era in the identification of high-risk individuals.
The SMART-MI Study
Future interventional studies are needed to test whether high-risk patients identified by PRD or other markers benefit from prophylactic strategies. Considering the fact that prevention of malignant arrhythmias is one of the main goals, prophylactic implantable cardioverter defibrillator implantation might appear to be the most logical approach. However, it might not be the only one. In the Cardiac Arrhythmias and Risk Stratification After Acute Myocardial Infarction (CARISMA) trial, implantable cardiac monitors (ICMs) were used to ultimately detect arrhythmias in high-risk post-MI patients characterised by LVEF ≤40 %.27 Predefined arrhythmias including AF as well as relevant brady- and tachyarrhythmias could be recorded with a high prevalence (46 % of the patients). Importantly, most of the detected arrhythmias (86 %) were initially asymptomatic, but predicted increased mortality risk, suggesting a potential window of opportunity for pre-emptive interventions.
The upcoming Implantable Cardiac Monitors in High-Risk PostInfarction Patients With Cardiac Autonomic Dysfunction and Moderately Reduced Left Ventricular Ejection Fraction (SMART-MI) study will test such an approach (Clinicaltrials.gov ID NCT02594488). Survivors of acute MI and LVEF 36–50 % will undergo autonomic testing for the presence of abnormal PRD17or DC.26 Patients with autonomic abnormalities will be randomised to ICM-based or conventional follow-up. Treatment paths have been developed for different kinds of arrhythmias including diagnostic work-up as well as medical or interventional treatments. The primary endpoint will be the time to detection of predefined relevant brady- and tachyarrhythmic events. The effect on clinical endpoints will be tested secondarily.
Conclusion
Spontaneous cardiac repolarisation instability is subject to rhythmic modulations in the low-frequency range (≤0.1Hz), which can be noninvasively assessed using 3D high-resolution ECGs. PRD most likely reflects the response of the ventricular myocardium to sympathetic activation. Factors that predispose to an inhomogeneous sympathetic innervation such as history of MI or diabetes mellitus are associated with increased PRD. In post-MI patients, increased PRD is a strong and independent predictor of mortality. PRSA-based assessment of PRD is a valuable alternative to the more complex conventional waveletbased PRD assessment. Future interventional studies are needed to test whether PRD-based risk prediction can be translated into risk reduction.